United Kingdom is a USD 2.8 Trillion economy. The country is home to 67 million residents, with a high consumption potential. UK’s GDP has shown positive growth trends increasing from USD 2.96 Trillion in 2015 to USD 3.2 Trillion in 2019. On an average, the household consumption expenditure accounts for approximately 63% of the GDP, indicating a potential consumer goods market. UK is also home to 3.51 lakh Non-resident Indians (NRIs) and 14.13 lakh Persons of Indian origin (PIOs) indicating a significant presence of Indian diaspora.
United Kingdom is a USD 670 Bn import market, which is largely serviced by exporters from China, the USA, European countries like Germany, Netherlands, France and SE-Asia. United Kingdom’s imports have grown from USD 636 Billion in 2016 to USD 692 Billion in 2019.
Due to the COVID induced lockdowns and disrupted global supply chains, UK’s imports contracted to USD 634 Bn in 2020. China contributes to 10% of imports to UK. The top 10 countries contributing approximately 63% of imports to United Kingdom are China, USA, Germany, France, Netherlands, Belgium, Italy, Spain, Norway, and Ireland. India is the 3rd largest exporter to UK among the Asian countries. On an average, India contributes to 1.3% of UK’s imports. A detailed list of key countries exporting to UK is attached in annexure 01.
A Free Trade Agreement (FTA) negotiation have been formally launched between India and UK recently, which is proposed to be concluded in the coming months in the form of an early harvest trade agreement, which shall cover 40% of services and 65% of products. The proposed FTA shall provide a potential competitiveness to Indian exporters targeting UK as a potential market for exports.

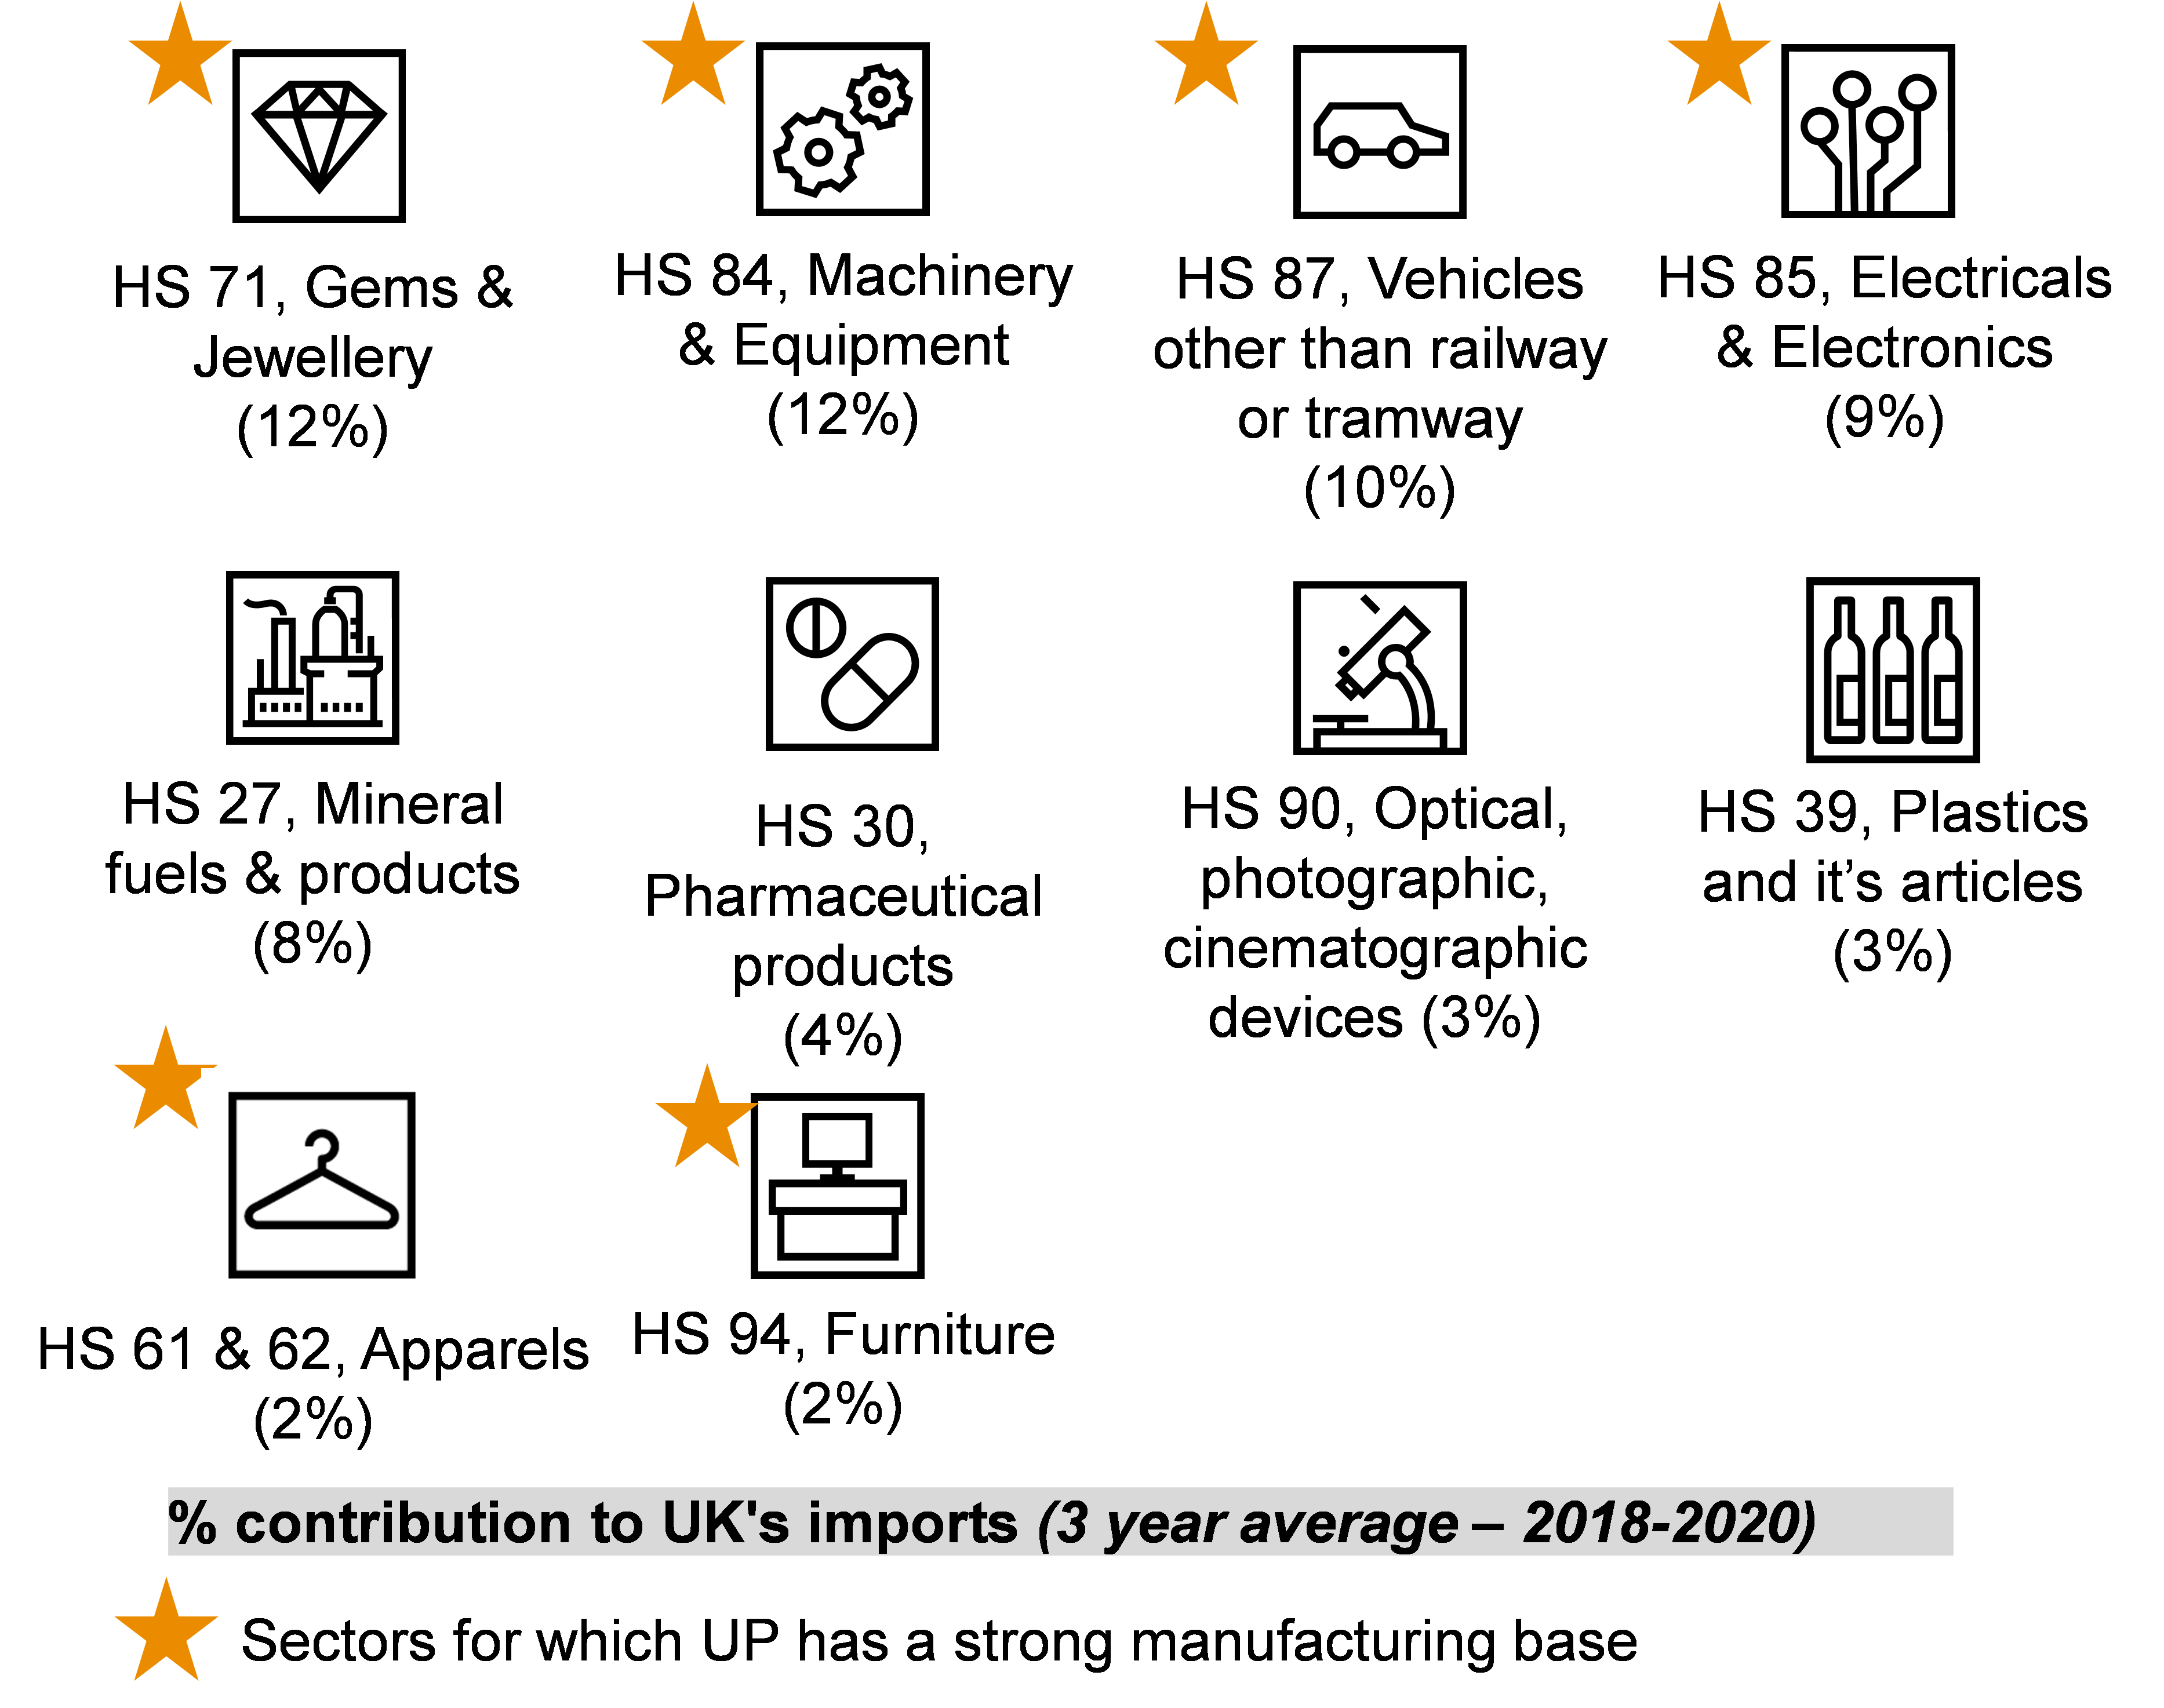
Of the USD 670 Billion import market in the UK, the leading sectors that contribute to 64% of UK’s imports are Gems & Jewellery, Machinery & equipment, Vehicles & auto-components, Electricals & electronics, mineral fuels, pharmaceuticals, Apparels, Plastics & its articles, Furniture and Optical, photographic & Cinematographic devices. A detailed list of sectors is attached in Annexure 2.
The United Kingdom is a USD 456 Bn market for services imports. The key sectors contributing to ~90% of UK’s services imports are listed in table 1. The key services sectors are travel, transportation, professional services including business & management services, computer services, engineering services, R&D, advertising, etc.
| HS Code | Product Description | 3 year average | % share |
|---|---|---|---|
| 'TOTAL | All Services | 456,339 | 100% |
| SOX1 | Memo item: Other commercial services | 146,679 | 32% |
| 4.2.3 | Travel, Personal, Other (other than health and education) | 61,871 | 14% |
| 10.3.5 | Other business services n.i.e. | 45,255 | 10% |
| 7.1 | Explicitly charged and other financial services | 17,255 | 4% |
| 3a.1 | Passenger transport, All modes (alternative breakdown) | 15,309 | 3% |
| 10.2.1.3 | Business and management consulting and public relations services | 14,061 | 3% |
| 3.2.1 | Passenger transport, Air | 13,863 | 3% |
| 3a.2 | Freight transport, All modes (alternative breakdown) | 9,980 | 2% |
| 3a.3 | Other transport (other than passenger and freight), All modes (alternative breakdown) | 9,346 | 2% |
| 10.1.1 | R&D, Work undertaken on a systematic basis to increase the stock of knowledge | 8,814 | 2% |
| 8.4 | Licences to reproduce and/or distribute audio-visual and related products | 6,830 | 1% |
| 4.1.2 | Travel, Business, Other (other than acquisition of goods and services by border and short-term workers) | 6,555 | 1% |
| 9.1 | Telecommunications services | 6,239 | 1% |
| 10.2.2 | Advertising, market research, and public opinion polling services | 6,156 | 1% |
| 9.2 | Computer services | 6,024 | 1% |
| 3.2.3 | Other transport, Air (other than passenger and freight) | 5,692 | 1% |
| 3.1.2 | Freight transport, Sea | 4,729 | 1% |
| 11.2 | Other personal, cultural, and recreational services (other than audiovisual and related) | 4,574 | 1% |
| 3.3.2 | Other modes of transport, Freight | 4,407 | 1% |
| 8.1 | Franchises and trademarks licensing fees | 4,242 | 1% |
| 7.2 | Financial intermediation services indirectly measured (FISIM) | 3,719 | 1% |
| 10.3.1.2 | Engineering services | 3,634 | 1% |
| 8.2 | Licences for the use of outcomes of research and development | 3,237 | 1% |
| 12.2 | Government, Military units and agencies | 3,099 | 1% |
| Others | 44,768 | 10% |
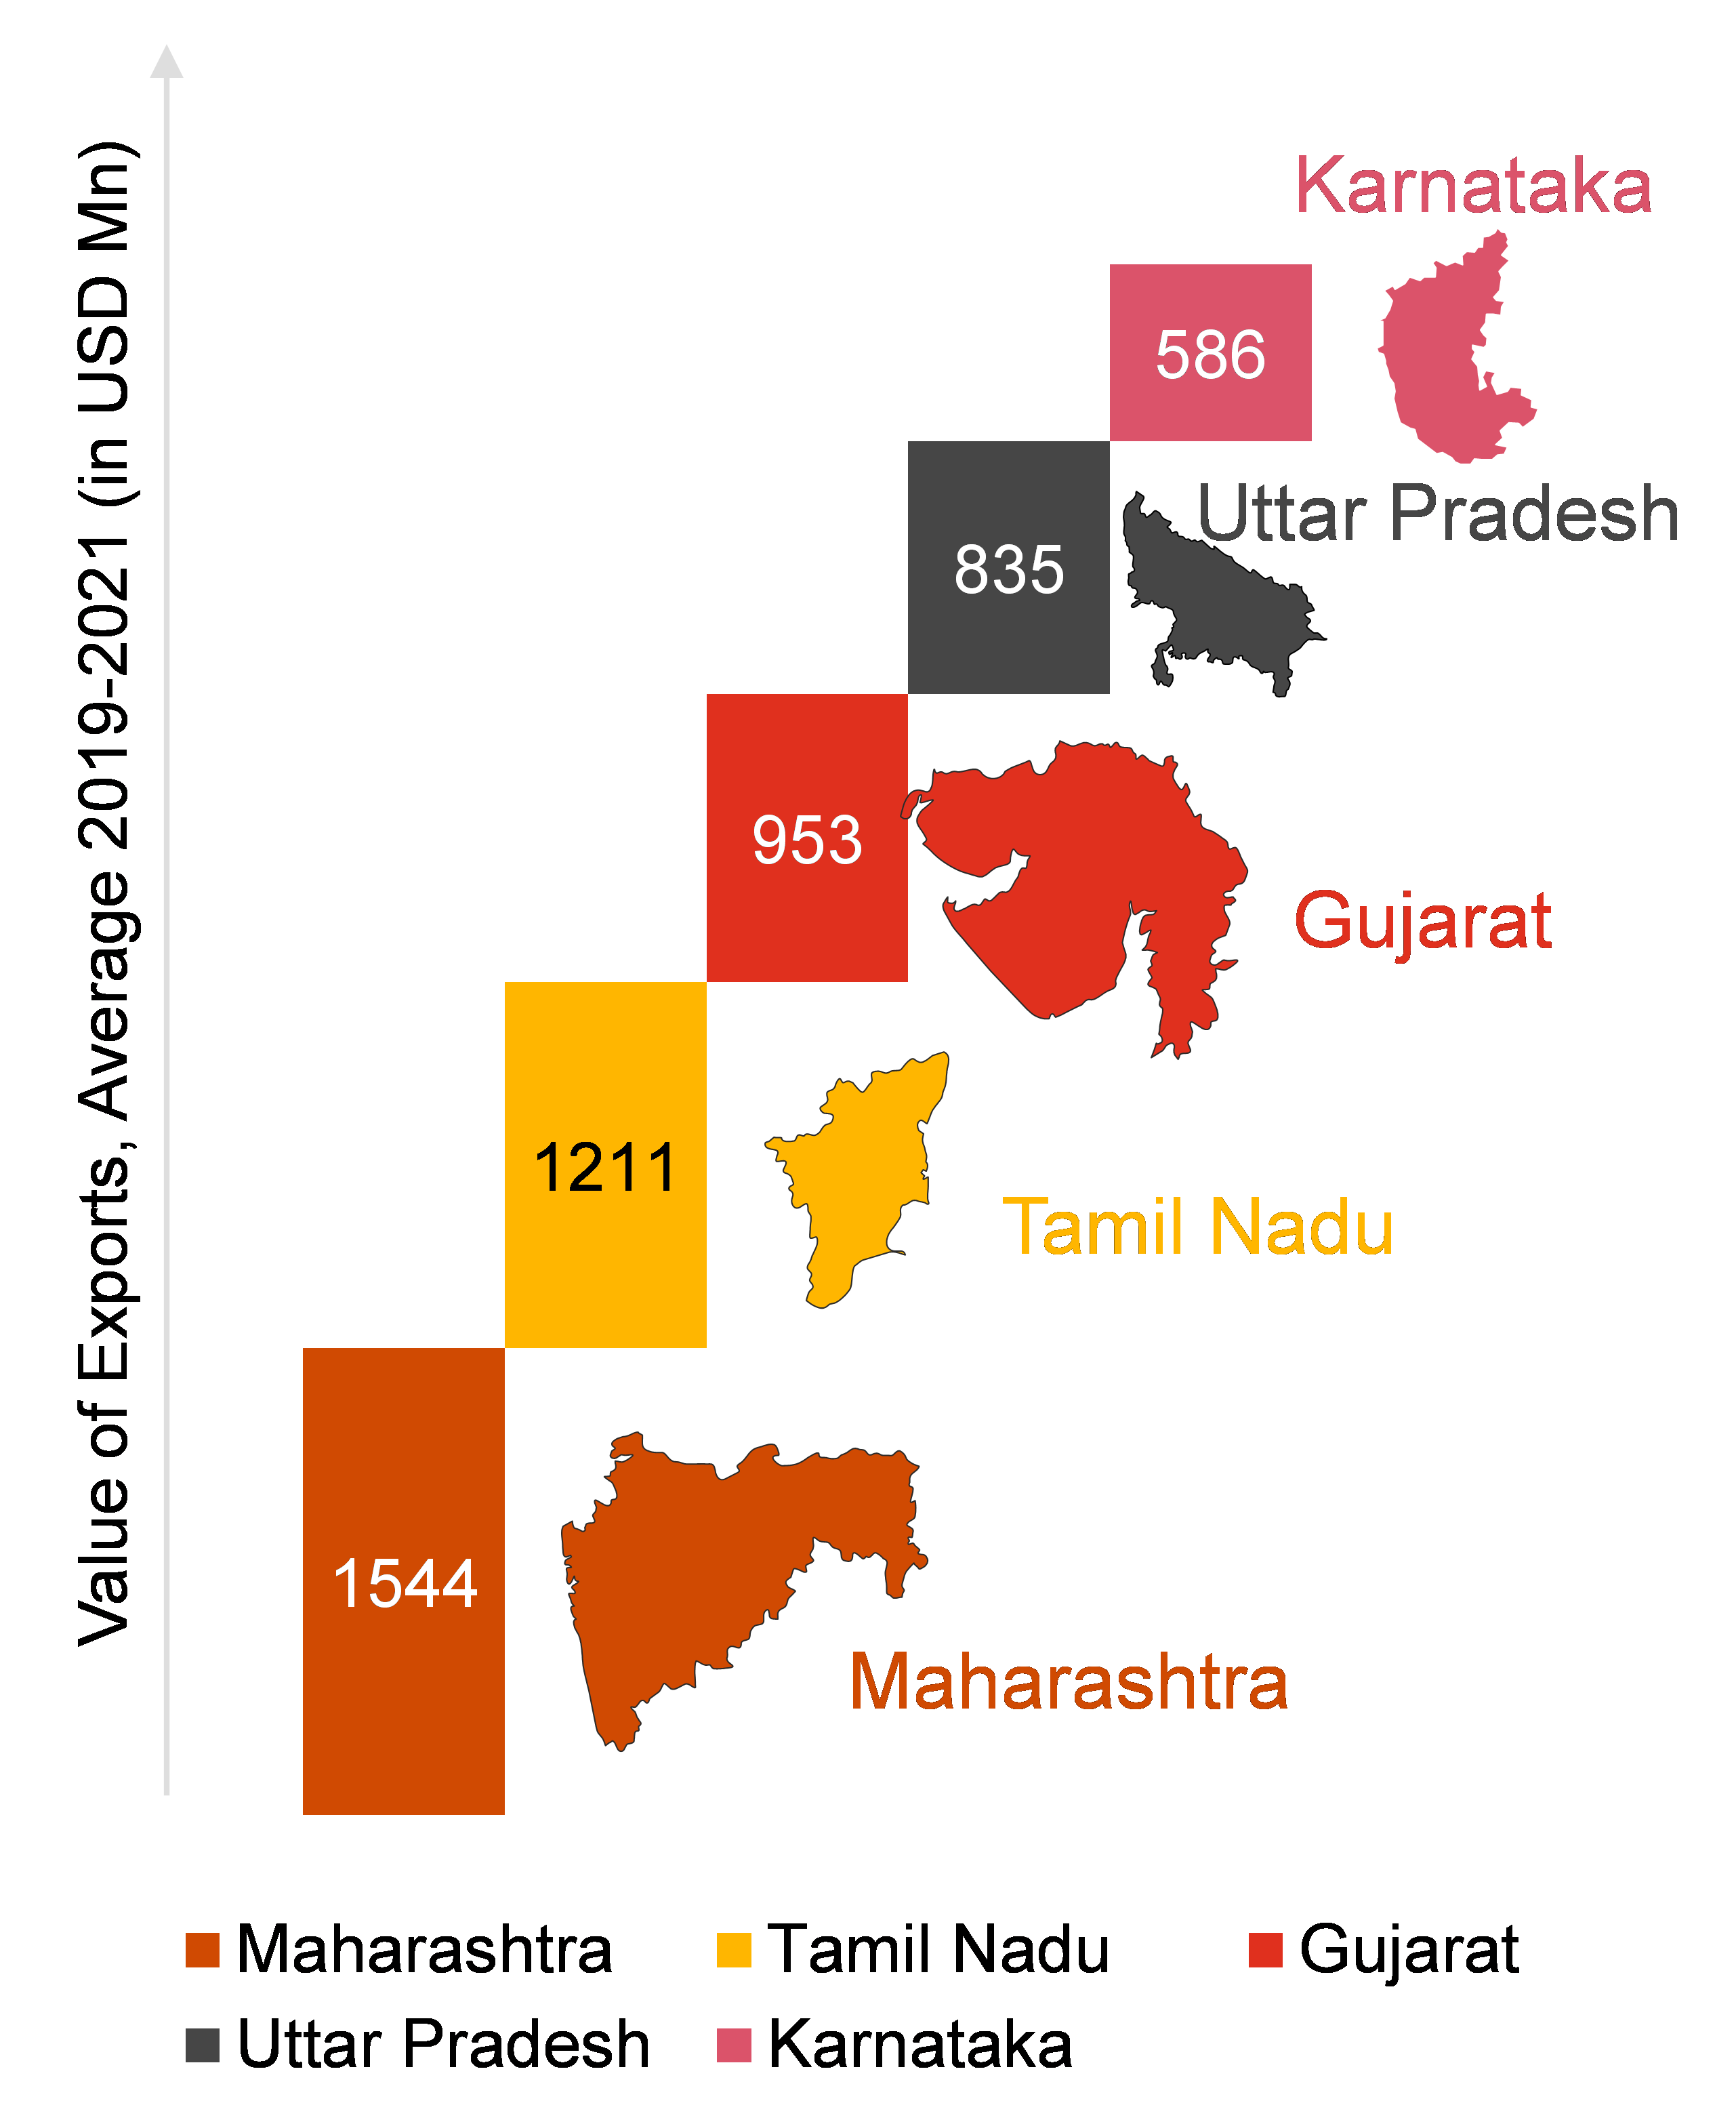
India exports an average of USD 890 Billion value of exports per year to UK. India’s share in UK’s imports have been steady at 1.4% from 2016 to 2020, exporting commodities of an average value of USD 10.81 Bn. Maharashtra, Tamil Nadu, Gujarat, Uttar Pradesh, and Karnataka are the top 5 states of India in terms of exports to United Kingdom, contributing approximately 47% of India’s exports to UK.
India’s exports to UK are characterized by exports of the following top 10 sectors: Mineral fuels & oils, gems & Jewellery, pharmaceuticals, machinery, articles of iron and steels, apparels & textiles, electricals & electronics, footwear, road vehicles & auto-components, organic chemicals, etc. as shown in table below. The table also discusses the percentage share of the sector in India’s exports to United Kingdom and the contribution of India’s exports in UK’s total imports of that sector at a HS 2 level. The sectors highlighted in yellow are the key sectors identified for driving exports growth from Uttar Pradesh.
| Table 2: Top sectors contributing to 67% of India’s exports to UK | ||||
|---|---|---|---|---|
| Sector | India’s exports to UK, (USD Mn) | % share of sector in India’s exports globally | % share of India’s exports to UK’s imports | |
| HS 61 & 62, Apparels | 1205 | 4.38% | 15.1% | |
| HS 84, Machinery & equipment | 860 | 6.4% | 10.8% | |
| HS 71, Gems & Jewellery | 559 | 10.2% | 7.0% | |
| HS 85, Electricals & electronics | 490 | 4.7% | 6.1% | |
| HS 30, Pharmaceutical | 481 | 5.3% | 6.0% | |
| HS 73, Article of Iron & Steel | 292 | 2.2% | 3.7% | |
| HS 64, Footwear, Gaiters & parts of such articles | 258 | 0.7% | 3.2% | |
| HS 29, Organic Chemicals | 249 | 5.7% | 3.1% | |
| HS 63, Textile Articles | 241 | 1.6% | 3.0% | |
| HS 87, Road Vehicles & parts | 240 | 4.9% | 3.0% | |
| Total exports (3 year average) | USD 297 Mn | |||
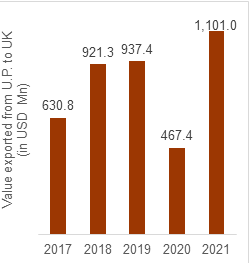
The exports from Uttar Pradesh to UK grew at a CAGR of 7.1% in the last 5 years. Uttar Pradesh exported a total of USD 1,101 Million value of commodities to United Kingdom in 2021. Post the COVID impact in 2020, the exports from UP to UK have accelerated by approximately 135% in 2021, indicating a high potential for growth in the future.
12 select sectors contributed to approximately 73% of UP’s exports to UK during the last 3 years. Export growth rate of 5 particular sectors in UK is higher than the growth rate of UP’s exports in all markets, thus acting as the drivers of Uttar Pradesh’s export growth in UK. The table below summarizes the top 12 products exported from UP to UK:
| HS code | Product description | Value of Exports (in USD Mn) | % share in UP’s exports to UK | Growth rate of exports from UP to UK | Growth rate of exports from UP to all markets |
|---|---|---|---|---|---|
| 61 & 62 | Articles of Apparels & Clothing | 1596.8 | 24.5% | -10% | -4.8% |
| 64 | Footwear, Gaiters & parts of such articles | 672.05 | 14.6% | -9.5% | -5.4% |
| 85 | Electricals & Electronics | 2773.92 | 9.5% | 102.1% | 9.4% |
| 83 | Miscellaneous articles of base metal | 193.34 | 8.2% | 34.5% | 34.6% |
| 73 | Article of Iron & Steel | 598.68 | 4.7% | 5.3% | 16.0% |
| 42 | Articles of leather; saddlery and harness | 372.26 | 4.1% | 10.3% | 7.4% |
| 39 | Plastics and articles thereof | 223.44 | 3.1% | -4.6% | 3.7% |
| 94 | Furnitures | 347.05 | 2.6% | 38.4% | 36.8% |
| 29 | Organic Chemicals | 483.67 | 2.5% | -19.3% | -1.8% |
| 71 | Gems and Jewelry | 269.84 | 2.2% | -4.3% | -22.4% |
| 57 | Carpets and other textile floor coverings | 546.51 | 1.8% | 13.5% | 9.5% |
| 76 | Aluminium and articles thereof | 556.23 | 1.8% | 9.7% | 8.2% |
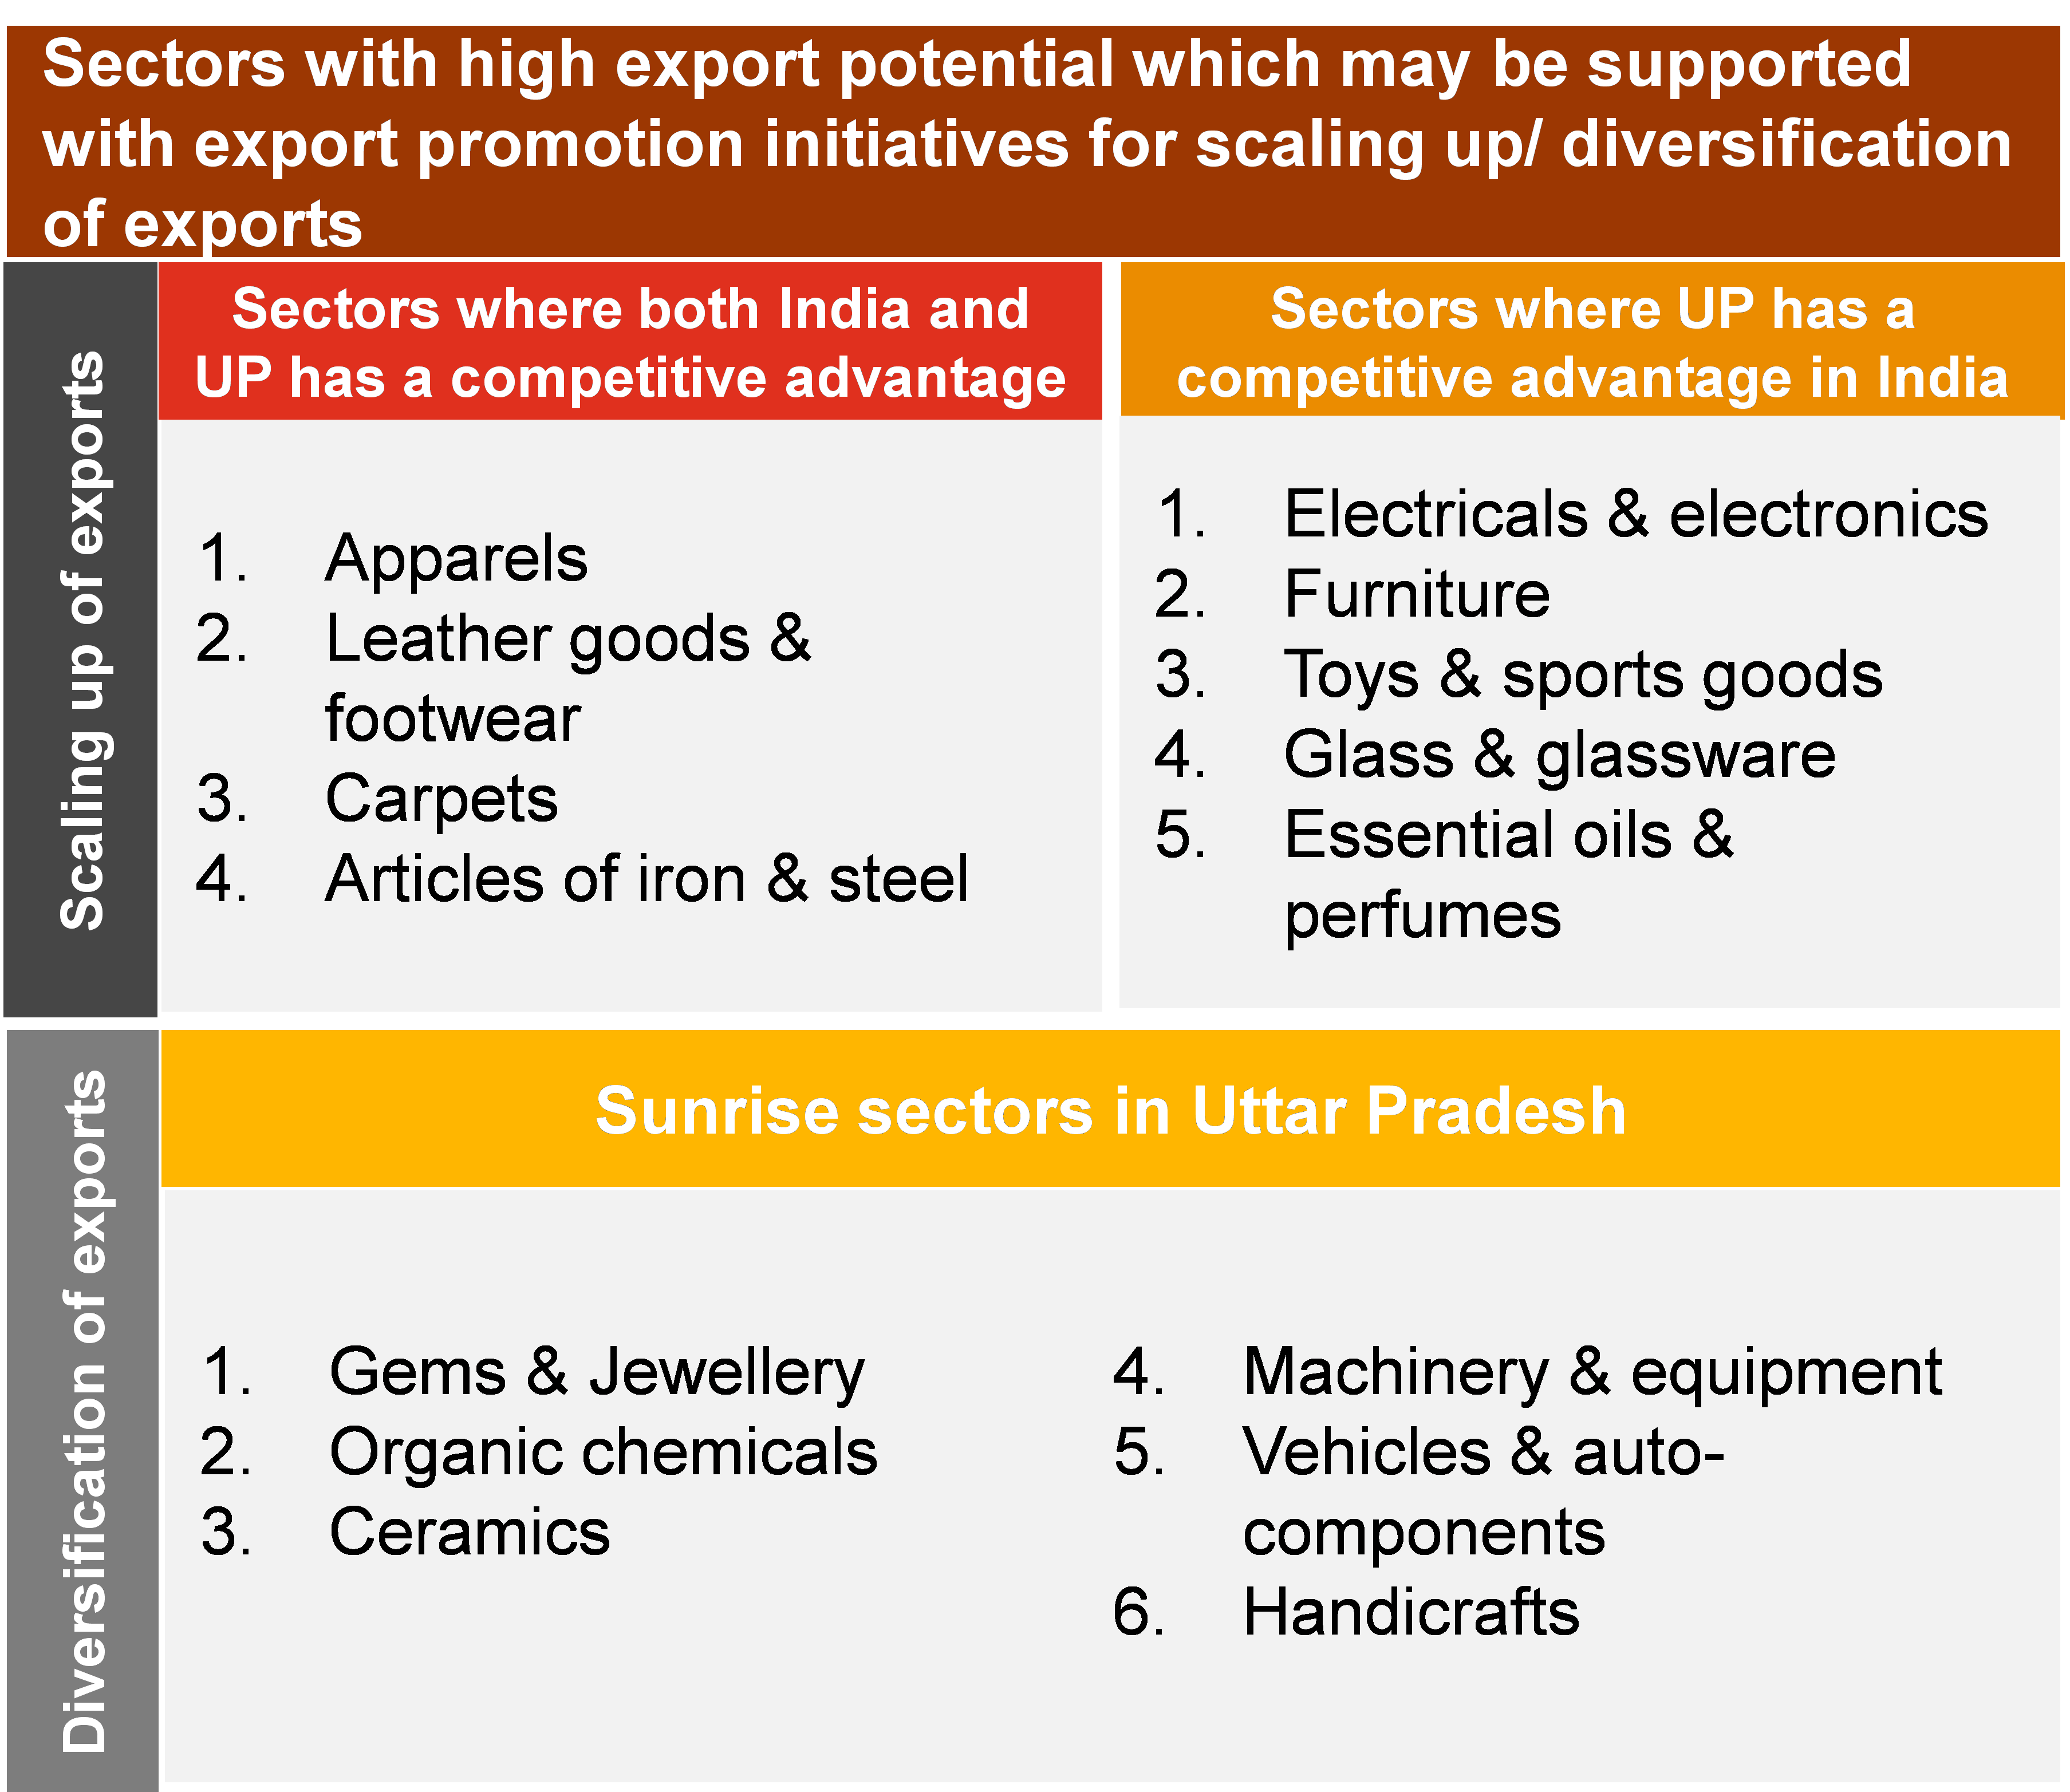
Uttar Pradesh’s export capabilities in select sectors resonates with the consumer demands in United Kingdom. At a global level, the priority sectors are classified on based on their RCA scores to identify the relevant export promotion strategies. The traditional sectors for which UP has a competitive advantage are selected for scaling up globally. Similarly, the sunrise sectors are selected for product development and market diversification to boost exports as shown in Figure 5.
Select sectors are identified as potential opportunities which may drive growth of exports from Uttar Pradesh to UK. The sectors are selected based on the import demand in UK, India’s exports to UK and UP’s exports to UK. The priority sectors shortlisted are classified into two categories, based on the relevant strategy for export promotion. The sectors with significant manufacturing and exports volume to UK are strategically selected for scaling up of exports. The sectors with appreciable manufacturing volume, but low level of exports from UP to UK are selected for market diversification into UK. The table below summarizes the top 10 sectors shortlisted for UP’s exporters who intend to undertake exports in UK. Gems & Jewellery, Vehicles & auto-components, electricals & electronics, plastics & its articles, apparels, furniture and articles of iron & steel are shortlisted for scaling up in UK. Similarly, Machinery, mechanical appliances & equipment, pharmaceutics and Optical, photographic, cinematographic & medical instruments are shortlisted for market diversification into UK. A comprehensive detail for the select 10 sectors at a HS 6 level is described in annexure 3. UK and India have initiated dialogues for a Free trade agreement (FTA) which may potentially create opportunities for scaling up of trade between India and the UK by improving trade cost competitiveness of Indian firms exporting to the United Kingdom. At a country level, the export trends are analyzed to identify country level strategies for export promotion as described in table 3. Further, to support exporters of the state in scaling of exports, the government of Uttar Pradesh through Export Promotion Bureau – Uttar Pradesh and Uttar Pradesh Export Promotion Council has planned to undertake the following initiatives: 1. Identifying and connecting with Sectoral bodies (for priority sectors) based in UK 2. Identifying importers and their sourcing needs 3. List of key events where UP's exporters shall participate 4. Facilitate visit of UK’s Importers to UP in key trade events that may be organized by Government of Uttar Pradesh 5. Identification of online platforms where UP's exporters should register for exporting their products to meet sourcing requirements of UK’s importers
| HS Code | Product Description | Value imported by UK (USD Mn) | Exports from India to UK (USD Mn) | UP’s exports to UK (USD Mn) | Potential intervention strategy |
|---|---|---|---|---|---|
| 71 | Gems & Jewelry | 98,746 | 355.4 | 16 | Scaling up |
| 84 | Machinery, mechanical appliances | 77,551 | 757.5 | 2.3 | Diversification |
| 87 | Vehicles & Auto-components | 66,489 | 240.2 | 11 | Scaling up |
| 85 | Electrical machinery and equipment | 58,949 | 292.7 | 41 | Scaling up |
| 30 | Pharmaceutical products | 27,051 | 401.5 | 2.3 | Diversification |
| 90 | Optical, photographic, cinematographic and medical instruments | 19,069 | 117.3 | 3.1 | Diversification |
| 39 | Plastics and articles thereof | 18,652 | 166.3 | 26 | Scaling up |
| 61 & 62 | Articles of apparel | 23,931 | 1149.4 | 190 | Scaling up |
| 94 | Furniture | 11,208 | 76.6 | 14 | Scaling up |
| 73 | Articles of iron or steel | 10,000 | 226.4 | 33 | Scaling up |
| Exporters | Imported value in 2018 | Imported value in 2019 | Imported value in 2020 | 3 year average | % share |
|---|---|---|---|---|---|
| Total | 671,694 | 692,494 | 634,175 | 663,335 | 100% |
| China | 63,391 | 65,529 | 75,478 | 70,504 | 11% |
| Germany | 92,101 | 85,679 | 74,403 | 80,041 | 12% |
| United States of America | 63,294 | 67,079 | 58,221 | 62,651 | 9% |
| Netherlands | 55,887 | 53,927 | 46,243 | 50,086 | 8% |
| France | 37,854 | 38,915 | 30,102 | 34,509 | 5% |
| Belgium | 34,731 | 32,224 | 28,810 | 30,517 | 5% |
| Italy | 26,732 | 26,251 | 23,700 | 24,976 | 4% |
| Spain | 21,119 | 21,209 | 18,567 | 19,889 | 3% |
| Russian Federation | 9,439 | 14,123 | 24,501 | 19,312 | 3% |
| Switzerland | 7,410 | 23,659 | 11,399 | 17,529 | 3% |
| Ireland | 18,328 | 17,619 | 17,381 | 17,500 | 3% |
| Norway | 25,567 | 19,784 | 13,510 | 16,648 | 3% |
| Canada | 13,667 | 15,907 | 15,044 | 15,476 | 2% |
| Poland | 14,435 | 14,265 | 13,926 | 14,096 | 2% |
| Turkey | 11,546 | 12,121 | 11,448 | 11,785 | 2% |
| Japan | 12,917 | 13,021 | 10,197 | 11,610 | 2% |
| Australia | 3,715 | 10,793 | 10,142 | 10,468 | 2% |
| Hong Kong, China | 2,455 | 4,406 | 14,790 | 9,598 | 1% |
| Area Nes | 63,391 | 65,529 | 75,478 | 9,523 | 1% |
| India | 92,101 | 85,679 | 74,403 | 8,655 | 1% |
| Others | 276,585 | 301,681 | 278,651 | 127,962 | 19% |
| HS Code | Product Description | Imported value in 2018 | Imported value in 2019 | Imported value in 2020 | 3 year average | % share |
|---|---|---|---|---|---|---|
| 'TOTAL | All products | 671,694 | 692,494 | 634,175 | 663,335 | 100% |
| '71 | Natural or cultured pearls, precious or semi-precious stones, precious metals, metals clad with precious metal, and articles thereof; imitation jewellery; coin | 40,140 | 89,132 | 108,359 | 98,746 | 15% |
| '84 | Machinery, mechanical appliances, nuclear reactors, boilers; parts thereof | 86,138 | 84,159 | 70,942 | 77,551 | 12% |
| '87 | Vehicles other than railway or tramway rolling stock, and parts and accessories thereof | 75,082 | 74,840 | 58,138 | 66,489 | 10% |
| '85 | Electrical machinery and equipment and parts thereof; sound recorders and reproducers, television image and sound recorders and reproducers, and parts and accessories of such articles | 63,561 | 61,743 | 56,154 | 58,949 | 9% |
| '27 | Mineral fuels, mineral oils and products of their distillation; bituminous substances; mineral waxes | 67,256 | 56,262 | 33,676 | 44,969 | 7% |
| '30 | Pharmaceutical products | 30,268 | 27,996 | 26,106 | 27,051 | 4% |
| '90 | Optical, photographic, cinematographic, measuring, checking, precision, medical or surgical instruments and apparatus; parts and accessories thereof | 18,725 | 19,080 | 19,058 | 19,069 | 3% |
| '39 | Plastics and articles thereof | 19,451 | 18,845 | 18,459 | 18,651 | 3% |
| '61 | Articles of apparel and clothing accessories, knitted or crocheted | 13,048 | 13,018 | 11,092 | 12,055 | 2% |
| '62 | Articles of apparel and clothing accessories, not knitted or crocheted | 11,959 | 11,887 | 11,863 | 11,875 | 2% |
| '94 | Furniture; bedding, mattresses, mattress supports, cushions and similar stuffed furnishings; lamps and lighting fittings, not elsewhere specified or included; illuminated signs, illuminated nameplates and the like; prefabricated buildings | 11,779 | 11,867 | 10,547 | 11,208 | 2% |
| '73 | Articles of iron or steel | 12,132 | 11,236 | 8,763 | 10,000 | 2% |
| '29 | Organic chemicals | 10,680 | 10,133 | 9,776 | 9,955 | 1% |
| '88 | Aircraft, spacecraft, and parts thereof | 11,191 | 10,879 | 8,037 | 9,458 | 1% |
| '99 | Commodities not elsewhere specified | 14,038 | 10,349 | 8,290 | 9,319 | 1% |
| '22 | Beverages, spirits and vinegar | 8,270 | 8,274 | 8,186 | 8,230 | 1% |
| '44 | Wood and articles of wood; wood charcoal | 7,654 | 7,400 | 7,171 | 7,285 | 1% |
| '48 | Paper and paperboard; articles of paper pulp, of paper or of paperboard | 7,970 | 7,500 | 6,903 | 7,201 | 1% |
| '38 | Miscellaneous chemical products | 6,021 | 6,319 | 7,511 | 6,915 | 1% |
| '95 | Toys, games and sports requisites; parts and accessories thereof | 6,334 | 6,101 | 6,709 | 6,405 | 1% |
| '64 | Footwear, gaiters and the like; parts of such articles | 6,890 | 6,928 | 5,812 | 6,370 | 1% |
| '08 | Edible fruit and nuts; peel of citrus fruit or melons | 6,442 | 6,303 | 6,431 | 6,367 | 1% |
| '33 | Essential oils and resinoids; perfumery, cosmetic or toilet preparations | 6,848 | 6,545 | 5,943 | 6,243 | 1% |
| '40 | Rubber and articles thereof | 5,743 | 5,281 | 5,707 | 5,494 | 1% |
| '02 | Meat and edible meat offal | 5,850 | 5,375 | 4,983 | 5,178 | 1% |
| '72 | Iron and steel | 7,136 | 5,958 | 4,137 | 5,047 | 1% |
| '63 | Other made-up textile articles; sets; worn clothing and worn textile articles; rags | 2,469 | 2,602 | 7,124 | 4,863 | 1% |
| '76 | Aluminium and articles thereof | 5,520 | 5,126 | 4,339 | 4,733 | 1% |
| '19 | Preparations of cereals, flour, starch or milk; pastrycooks' products | 4,339 | 4,614 | 4,805 | 4,710 | 1% |
| Others | 26,414 | 25,191 | 24,481 | 25,362 | 14% |
| HS Code (6 digit) | Product Description | Share in UK’s import at the HS 2 level | Average share in global imports at HS2 level | Global exports by India | India’s share in global exports | Global exports by Uttar Pradesh |
|---|---|---|---|---|---|---|
| HS 71 – Gems & Jewellery | ||||||
| '710813 | Gold, incl. gold plated with platinum, in semi-manufactured forms, for non-monetary purposes | 80.4% | 15.9% | 3.16 | 0 | 0 |
| Total of top commodity | 80.4% | 3.16 | 0 | |||
| Rest of the commodities under HS code 71 | 19.6% | 30595 | 277.8 | |||
| HS 84 – Machinery, mechanical appliances and equipment | ||||||
| '847130 | Data-processing machines, automatic, portable, weighing <= 10 kg, consisting of at least a central processing unit, a keyboard and a display (excluding peripheral units) | 10.8% | 7.2% | 35.22 | 0.02% | 0.5 |
| '841191 | Parts of turbojets or turbopropellers, n.e.s. | 10.0% | 3.2% | 100.54 | 0.21% | 0 |
| '841112 | Turbojets of a thrust > 25 kN | 9.7% | 2.6% | 2861.06 | 5.88% | 0 |
| '847150 | Processing units for automatic data-processing machines, whether or not containing in the same housing one or two of the following types of unit: storage units, input units, output units (excluding those of heading 8471.41 or 8471.49 and excluding peripheral units) | 2.9% | 3.6% | 46.17 | 0.06% | 0.4 |
| '847330 | Parts and accessories of automatic data-processing machines or for other machines of heading 8471, n.e.s. | 2.6% | 5.7% | 101.60 | 0.08% | 6.3 |
| '847170 | Storage units for automatic data-processing machines | 2.3% | 3.5% | 23.83 | 0.04% | 0.1 |
| '840991 | Parts suitable for use solely or principally with spark-ignition internal combustion piston engine, n.e.s. | 2.6% | 1.3% | 302.77 | 1.05% | 20.7 |
| '848180 | Appliances for pipes, boiler shells, tanks, vats or the like (excluding pressure-reducing valves, valves for the control of pneumatic power transmission, check "non-return" valves and safety or relief valves) | 2.2% | 2.4% | 821.51 | 1.58% | 14.3 |
| '844399 | Parts and accessories of printers, copying machines and facsimile machines, n.e.s. (excluding of printing machinery used for printing by means of plates, cylinders and other printing components of heading 8442) | 2.1% | 2.1% | 33.77 | 0.08% | 3.8 |
| '847149 | Data-processing machines, automatic, presented in the form of systems "comprising at least a central processing unit, one input unit and one output unit" (excluding portable weighing <= 10 kg and excluding peripheral units) | 1.6% | 0.7% | 11.81 | 0.05% | 0.3 |
| Total of top 10 commodities | 46.8% | 4338.28 | 46.4 | |||
| Rest of the commodities under HS code 84 | 53.2% | 19617 | 511.7 | |||
| HS 87 – Vehicles & Auto-components | ||||||
| '870322 | Motor cars and other motor vehicles principally designed for the transport of persons, incl. station wagons and racing cars, with spark-ignition internal combustion reciprocating piston engine of a cylinder capacity > 1.000 cm³ but <= 1.500 cm³ (excluding vehicles for the transport of persons on snow and other specially designed vehicles of subheading 8703.10) | 13.5% | 8.0% | 2562.69 | 2.5% | 2.5 |
| '870323 | Motor cars and other motor vehicles principally designed for the transport of persons, incl. station wagons and racing cars, with spark-ignition internal combustion reciprocating piston engine of a cylinder capacity > 1.500 cm³ but <= 3.000 cm³ (excluding vehicles for the transport of persons on snow and other specially designed vehicles of subheading 8703.10) | 11.8% | 18.0% | 1681.86 | 0.7% | 0 |
| '870332 | Motor cars and other motor vehicles principally designed for the transport of persons, incl. station wagons and racing cars, with compression-ignition internal combustion piston engine "diesel or semi-diesel engine" of a cylinder capacity > 1.500 cm³ but <= 2.500 cm³ (excluding vehicles for the transport of persons on snow and other specially designed vehicles of subheading 8703.10) | 11.5% | 6.4% | 130.91 | 0.1% | 0 |
| '870421 | Motor vehicles for the transport of goods, with compression-ignition internal combustion piston engine "diesel or semi-diesel engine" of a gross vehicle weight > 5 t but <= 20 t (excluding dumpers for off-highway use of subheading 8704.10 and special purpose motor vehicles of heading 8705) | 7.9% | 4.0% | 198.99 | 0.4% | 0.2 |
| '870899 | Parts and accessories, for tractors, motor vehicles for the transport of ten or more persons, motor cars and other motor vehicles principally designed for the transport of persons, motor vehicles for the transport of goods and special purpose motor vehicles, n.e.s. | 6.4% | 5.8% | 2380.69 | 2.9% | 92.1 |
| '870321 | Motor cars and other motor vehicles principally designed for the transport of persons, incl. station wagons and racing cars, with spark-ignition internal combustion reciprocating piston engine of a cylinder capacity <= 1.000 cm³ (excluding vehicles for the transport of persons on snow and other specially designed vehicles of subheading 8703.10) | 6.1% | 3.0% | 1336.53 | 3.7% | 0.03 |
| '870380 | Motor cars and other motor vehicles principally designed for the transport of <10 persons, incl. station wagons and racing cars, with only electric motor for propulsion (excl. vehicles for travelling on snow and other specially designed vehicles of subheading 8703.10) | 3.9% | 2.1% | 2.1 | 0.0% | 0.03 |
| '870340 | Motor cars and other motor vehicles principally designed for the transport of <10 persons, incl. station wagons and racing cars, with both spark-ignition internal combustion reciprocating piston engine and electric motor as motors for propulsion (excl. vehicles for travelling on snow, other specially designed vehicles of subheading 8703.10 and plug-in hybrids) | 3.8% | 2.7% | 1.64 | 0.0% | 0 |
| '870829 | Parts and accessories of bodies for tractors, motor vehicles for the transport of ten or more persons, motor cars and other motor vehicles principally designed for the transport of persons, motor vehicles for the transport of goods and special purpose motor vehicles (excluding bumpers and parts thereof and safety seat belts) | 3.6% | 5.2% | 156.49 | 0.2% | 0.3 |
| Total of top 9 commodities | 68.5% | 8451.9 | 95.16 | |||
| Rest of the commodities under HS code 87 | 31.5% | 15204.7 | 357.1 | |||
| HS 85 – Electricals & electronics | ||||||
| '851712 | Telephones for cellular networks "mobile telephones" or for other wireless networks | 17.7% | 9.4% | 3197.38 | 1.2% | 1742.6 |
| '851762 | Machines for the reception, conversion and transmission or regeneration of voice, images or other data, incl. switching and routing apparatus (excluding telephone sets, telephones for cellular networks or for other wireless networks) | 12.9% | 5.8% | 537.46 | 0.3% | 0.4 |
| '852872 | Reception apparatus for television, colour, whether or not incorporating radio-broadcast receivers or sound or video recording or reproducing apparatus, designed to incorporate a video display or screen | 3.6% | 1.5% | 4.64 | 0.0% | 0.8 |
| '850440 | Static converters | 2.6% | 2.2% | 1121.98 | 1.8% | 10.6 |
| '853710 | Boards, cabinets and similar combinations of apparatus for electric control or the distribution of electricity, for a voltage <= 1.000 V | 2.7% | 2.0% | 430.54 | 0.7% | 15.2 |
| '852580 | Television cameras, digital cameras and video camera recorders | 1.9% | 1.3% | 69.10 | 0.2% | 8.2 |
| '854430 | Ignition wiring sets and other wiring sets for vehicles, aircraft or ships | 2.2% | 1.4% | 213.34 | 0.6% | 51 |
| '852852 | Monitors capable of directly connecting to and designed for use with an automatic data processing machine of heading 8471 (excl. CRT, with TV receiver) | 1.9% | 0.7% | 5.65 | 0.0% | 0.1 |
| '854449 | Electric conductors, for a voltage <= 1.000 V, insulated, not fitted with connectors, n.e.s. | 1.9% | 0.9% | 300.86 | 1.1% | 5.2 |
| '854370 | Electrical machines and apparatus, having individual functions, n.e.s. in chapter 85 | 1.8% | 1.1% | 84.54 | 0.2% | 5.4 |
| Total of top 10 commodities | 49.3% | 5965.49 | 1839.5 | |||
| Rest of the commodities under HS code 85 | 50.7% | 14203 | 2310.5 | |||
| HS 30 - Pharmaceuticals | ||||||
| '300490 | Medicaments consisting of mixed or unmixed products for therapeutic or prophylactic purposes, put up in measured doses "incl. those in the form of transdermal administration" or in forms or packings for retail sale (excluding medicaments containing antibiotics, medicaments containing hormones or steroids used as hormones, but not containing antibiotics, medicaments containing alkaloids or derivatives thereof but not containing hormones or antibiotics and medicaments containing provitamins, vitamins or derivatives thereof used as vitamins) | 44.7% | 48.5% | 13224.94 | 4.4% | 54.1 |
| '300215 | Immunological products, put up in measured doses or in forms or packings for retail sale | 14.3% | 16.3% | 150.76 | 0.1% | 0.05 |
| '300390 | Medicaments consisting of two or more constituents mixed together for therapeutic or prophylactic uses, not in measured doses or put up for retail sale (excluding antibiotics containing hormones or steroids used as hormones, but not containing antibiotics, alkaloids or derivatives thereof, hormones or antibiotics or goods of heading 3002, 3005 or 3006) | 13.4% | 1.5% | 308.47 | 4.2% | 48 |
| Total of top 3 commodities | 72.4% | 13684.17 | 48.05 | |||
| Rest of the commodities under HS code 30 | 27.6% | 17345 | 110.6 | |||
| HS 90 - Optical, photographic, cinematographic, surgical and medical instruments | ||||||
| '901890 | Instruments and appliances used in medical, surgical or veterinary sciences, n.e.s. | 10.9% | 10.1% | 294.59 | 0.5% | 5.2 |
| '901839 | Needles, catheters, cannulae and the like, used in medical, surgical, dental or veterinary sciences (excluding syringes, tubular metal needles and needles for sutures) | 4.9% | 4.9% | 319.01 | 1.0% | 14.2 |
| '903289 | Regulating or controlling instruments and apparatus (excluding hydraulic or pneumatic, manostats, thermostats, and taps, cocks and valves of heading 8481) | 4.2% | 3.8% | 217.51 | 1.0% | 1.8 |
| '903180 | Instruments, appliances and machines for measuring or checking, not elsewhere specified in chapter 90 (excluding optical) | 3.3% | 4.1% | 101.83 | 0.5% | 3.3 |
| '902190 | Articles and appliances, which are worn or carried, or implanted in the body, to compensate for a defect or disability (excluding artificial parts of the body, complete hearing aids and complete pacemakers for stimulating heart muscles) | 3.1% | 2.2% | 27.78 | 0.2% | 0.5 |
| '902790 | Microtomes; parts and accessories of instruments and apparatus for physical or chemical analysis, instruments and apparatus for measuring or checking viscosity, porosity, expansion, surface tension or the like, instruments and apparatus for measuring or checking quantities of heat, sound or light, and of microtomes, n.e.s. | 2.9% | 2.1% | 26.73 | 0.2% | 0.5 |
| '902780 | Instruments and apparatus for physical or chemical analysis, or for measuring or checking viscosity, porosity, expansion, surface tension or the like, or for measuring or checking quantities of heat, sound or light, n.e.s. | 2.7% | 2.3% | 33.82 | 0.3% | 21.1 |
| '900130 | Contact lenses | 2.6% | 1.1% | 10.21 | 0.1% | 0 |
| '902131 | Artificial joints for orthopaedic purposes | 2.5% | 1.7% | 21.78 | 0.2% | 0.0 |
| '902110 | Orthopaedic or fracture appliances | 2.5% | 1.8% | 50.08 | 0.5% | 1.5 |
| Total of top 10 commodities | 38.6% | 2374.29 | 105.44 | |||
| Rest of the commodities under HS code 90 | 61.4% | 6974.87 | 200.1 | |||
| HS 39 – Plastics and its articles | ||||||
| '392690 | Articles of plastics and articles of other materials of heading 3901 to 3914, n.e.s (excluding goods of 9619) | 10.6% | 10.8% | 555.98 | 0.8% | 18 |
| '392620 | Articles of apparel and clothing accessories produced by the stitching or sticking together of plastic sheeting, incl. gloves, mittens and mitts (excluding goods of 9619) | 4.4% | 1.2% | 7.33 | 0.1% | 0.04 |
| '392321 | Sacks and bags, incl. cones, of polymers of ethylene | 3.6% | 1.8% | 156.71 | 1.3% | 0.4 |
| '390120 | Polyethylene with a specific gravity of >= 0,94, in primary forms | 3.9% | 4.6% | 416.12 | 1.5% | 15.8 |
| '392190 | Plates, sheets, film, foil and strip, of plastics, reinforced, laminated, supported or similarly combined with other materials, unworked or merely surface-worked or merely cut into squares or rectangles (excluding of cellular plastic; self-adhesive products, floor, wall and ceiling coverings of heading 3918) | 3.2% | 2.4% | 312 | 2.1% | 61.9 |
| '392010 | Plates, sheets, film, foil and strip, of non-cellular polymers of ethylene, not reinforced, laminated, supported or similarly combined with other materials, without backing, unworked or merely surface-worked or merely cut into squares or rectangles (excluding self-adhesive products, and floor, wall and ceiling coverings of heading 3918) | 3.0% | 2.5% | 86.64 | 0.5% | 1.7 |
| '392020 | Plates, sheets, film, foil and strip, of non-cellular polymers of ethylene, not reinforced, laminated, supported or similarly combined with other materials, without backing, unworked or merely surface-worked or merely cut into squares or rectangles (excluding self-adhesive products, and floor, wall and ceiling coverings of heading 3918) | 2.5% | 1.6% | 283.61 | 2.9% | 3.9 |
| '392330 | Carboys, bottles, flasks and similar articles for the conveyance or packaging of goods, of plastics | 2.5% | 1.5% | 46.69 | 0.5% | 0.5 |
| '390110 | Polyethylene with a specific gravity of < 0,94, in primary forms | 2.7% | 3.9% | 409.03 | 1.8% | 2.5 |
| '390690 | Acrylic polymers, in primary forms (excluding poly"methyl methacrylate") | 2.2% | 2.4% | 100.18 | 0.7% | 0.7 |
| Total of top 10 commodities | 38.6% | 2374.29 | 105.44 | |||
| Rest of the commodities under HS code 39 | 61.4% | 6974.87 | 200.1 | |||
| HS 61& 62 – Apparels | ||||||
| '610910 | T-shirts, singlets and other vests of cotton, knitted or crocheted | 14.7% | 13.4% | 1440.7 | 4.8% | 49.5 |
| '621010 | Garments made up of felt or nonwovens, whether or not impregnated, coated, covered or laminated (excluding babies' garments and clothing accessories) | 12.8% | 4.8% | 44.5 | 0.5% | 3.6 |
| '611020 | Jerseys, pullovers, cardigans, waistcoats and similar articles, of cotton, knitted or crocheted (excluding wadded waistcoats) | 10.6% | 11.9% | 140.2 | 0.6% | 18.1 |
| '611030 | Jerseys, pullovers, cardigans, waistcoats and similar articles, of man-made fibres, knitted or crocheted (excluding wadded waistcoats) | 9.7% | 10.8% | 63.9 | 0.3% | 4.9 |
| '620462 | Women's or girls' trousers, bib and brace overalls, breeches and shorts of cotton (excluding knitted or crocheted, panties and swimwear) | 7.3% | 8.6% | 195 | 1.0% | 22.5 |
| '620342 | Men's or boys' trousers, bib and brace overalls, breeches and shorts, of cotton (excluding knitted or crocheted, underpants and swimwear) | 7.3% | 10.9% | 438.3 | 1.8% | 11.2 |
| '610990 | T-shirts, singlets and other vests of textile materials, knitted or crocheted (excluding cotton) | 6.0% | 5.9% | 474 | 3.3% | 16 |
| Total of top 7 commodities | 68.40% | 2796.6 | 125.8 | |||
| Rest of the commodities under HS code 61 & 62 | 31.60% | 4260 | 1738 | |||
| HS 94 – Furnitures | ||||||
| '940360 | Wooden furniture (excluding for offices, kitchens and bedrooms, and seats) | 16.1% | 10.5% | 552.04 | 2.1% | 33.5 |
| '940190 | Parts of seats, n.e.s. | 11.6% | 12.9% | 65.84 | 0.2% | 6.4 |
| '940161 | Upholstered seats, with wooden frames (excluding convertible into beds) | 9.0% | 7.7% | 18.42 | 0.1% | 0.2 |
| '940320 | Metal furniture (excluding for offices, seats and medical, surgical, dental or veterinary furniture) | 7.0% | 7.2% | 145.36 | 0.8% | 14.4 |
| '940390 | Parts of furniture, n.e.s. (excluding of seats and medical, surgical, dental or veterinary furniture) | 7.5% | 5.8% | 28.01 | 0.2% | 5.1 |
| '940540 | Electric lamps and lighting fittings, n.e.s. | 6.4% | 7.2% | 37.60 | 0.2% | 3.2 |
| '940350 | Wooden furniture for bedrooms (excluding seats) | 6.1% | 4.8% | 13.6 | 0.1% | 0.1 |
| '940510 | Chandeliers and other electric ceiling or wall lighting fittings (excluding for lighting public open spaces or thoroughfares) | 5.1% | 6.7% | 52.9 | 0.3% | 15.6 |
| Total of top 8 commodities | 68.8% | 728.03 | 78.5 | |||
| Rest of the commodities under HS code 42 | 31.2% | 1828 | 235.63 | |||
| HS 73 – Articles of Iron and Steel | ||||||
| '732690 | Articles of iron or steel, n.e.s. (excluding cast articles or articles of iron or steel wire) | 16.8% | 16.0% | 714.92 | 1.7% | 251.1 |
| '730890 | Structures and parts of structures, of iron or steel, n.e.s. (excluding bridges and bridge-sections, towers and lattice masts, doors and windows and their frames, thresholds for doors, props and similar equipment for scaffolding, shuttering, propping or pit-propping) | 15.2% | 11.3% | 482.35 | 1.3% | 11 |
| '731815 | Threaded screws and bolts, of iron or steel, whether or not with their nuts and washers (excluding coach screws and other wood screws, screw hooks and screw rings, self-tapping screws, lag screws, stoppers, plugs and the like, threaded) | 4.9% | 6.2% | 273.18 | 1.5% | 1.8 |
| '730820 | Towers and lattice masts, of iron or steel | 3.8% | 1.5% | 348.09 | 9.7% | 6.8 |
| '732219 | Radiators for central heating, non-electrically heated, and parts thereof, of iron other than cast iron or steel (excluding parts, elsewhere specified or included, and central-heating boilers) | 2.8% | 0.6% | 0.33 | 0.0% | 0 |
| '730840 | Equipment for scaffolding, shuttering, propping or pit-propping (excluding composite sheetpiling products and formwork panels for poured-in-place concrete, which have the characteristics of moulds) | 2.5% | 1.6% | 177.20 | 3.7% | 0.2 |
| '732393 | Table, kitchen or other household articles, and parts thereof, of stainless steel (excluding cans, boxes and similar containers of heading 7310; waste baskets; shovels, corkscrews and other articles of the nature of a work implement; articles of cutlery, spoons, ladles, forks etc. of heading 8211 to 8215; ornamental articles; sanitary ware) | 2.3% | 2.3% | 342.59 | 4.4% | 22.3 |
| '732111 | Appliances for baking, frying, grilling and cooking and plate warmers, for domestic use, of iron or steel, for gas fuel or for both gas and other fuels (excluding large cooking appliances) | 2.1% | 1.9% | 11.07 | 0.2% | 0.4 |
| '731816 | Nuts of iron or steel | 1.8% | 2.1% | 62.89 | 1.1% | 1.0 |
| '732399 | Table, kitchen or other household articles, and parts thereof, of iron other than cast iron or steel other than stainless (excluding enamelled articles; cans, boxes and similar containers of heading 7310; waste baskets; shovels and other articles of the nature of a work implement; cutlery, spoons, ladles etc. of heading 8211 to 8215; ornamental articles; sanitary ware) | 1.6% | 1.2% | 52.83 | 1.2% | 2.9 |
| Total of top 10 commodities | 53.8% | 2465.45 | 297.5 | |||
| Rest of the commodities under HS code 57 | 46.2% | 6751 | 474.8 | |||
